Customer Behaviour Analytics
A self-directed portfolio project on a public retail dataset — not client work. I answered ten commercial questions in SQL and built a Power BI dashboard that showed the real opportunity was monetising an already-loyal customer base rather than chasing new buyers. Built independently, end to end, to demonstrate the full analysis workflow from raw data to a decision.
Case Study 5 — Customer Shopping Behaviour Analysis
The Problem
A retailer had transactional data sitting in a spreadsheet but no view of who actually drives revenue. Leadership couldn't answer basic commercial questions: which customers are worth retaining, whether discounts are buying loyalty or just eroding margin, whether subscribers spend more, and which products deserve shelf priority. Raw transactions don't answer those — they have to be cleaned, modelled and asked the right questions.
What I Built
An end-to-end analytics pipeline, from raw file to boardroom-ready dashboard:
- Clean (Python / pandas) — loaded the data, profiled it with
df.info()and.describe(), and handled missing values: 37 missing review ratings imputed with the median rating of their own product category, not a single global median and not by dropping the rows. Two deliberate choices there: the median because it isn't dragged by outliers the way the mean is, and per category because Clothing, Footwear and Accessories have genuinely different rating distributions — one blended average would have pulled ratings toward the middle and introduced bias into every category at once. - Analyse (PostgreSQL) — loaded the cleaned data into Postgres and answered 10 business questions in SQL, using CTEs, window functions, conditional aggregation and subqueries.
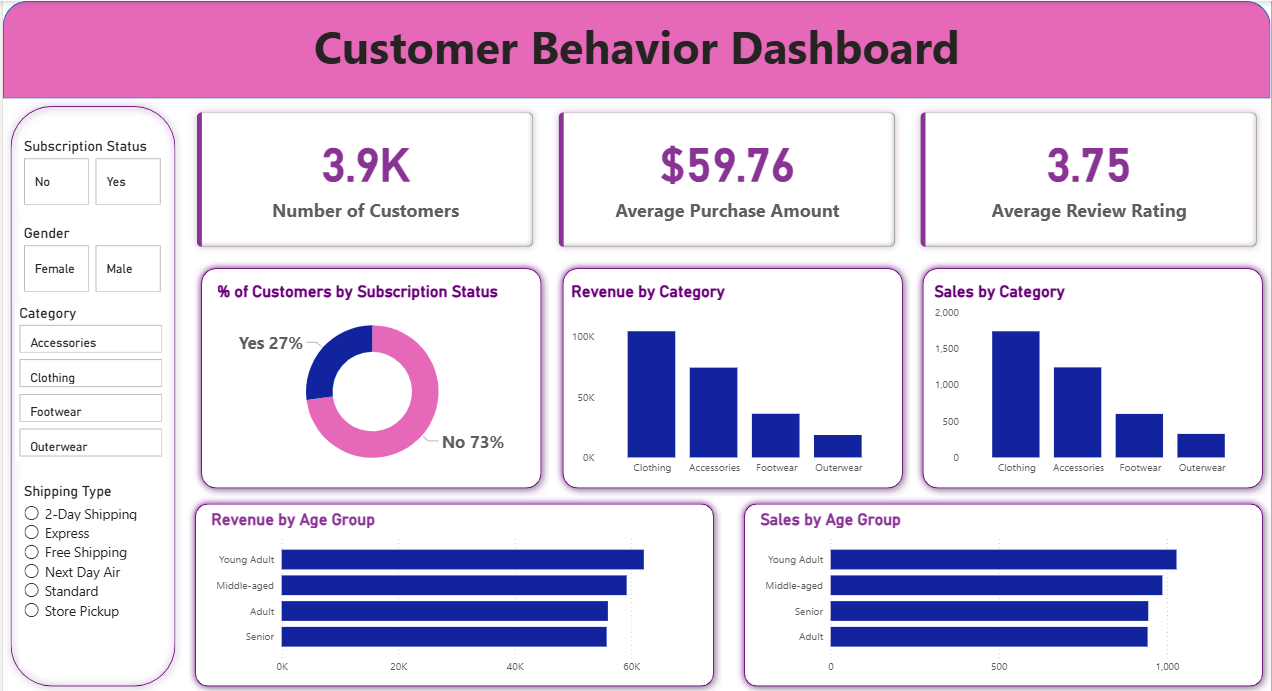
- Visualise (Power BI) — built an interactive Customer Behaviour Dashboard with KPI cards, slicers (subscription, gender, category, shipping type) and revenue/sales breakdowns by category and age group.
- Communicate — wrote a structured report and a stakeholder presentation with prioritised recommendations.
The Data
| Transactions | 3,900 |
| Columns | 18 |
| Missing values handled | 37 review ratings (category-wise median imputation) |
| Fields | demographics, purchase amount, category, item, review rating, discount, subscription, shipping type, previous purchases |
The SQL Techniques
This project is where the SQL craft shows:
- CTEs (
WITH …) to stage logic in readable steps — used to build a customer-segmentation layer before aggregating it. - Window functions —
ROW_NUMBER() OVER (PARTITION BY category ORDER BY COUNT(customer_id) DESC)to rank the top products within each category. - A deliberate ranking choice. I used
ROW_NUMBER()rather thanRANK()orDENSE_RANK()because ties would have produced shared ranks and fewer than three distinct products per category.ROW_NUMBER()guarantees exactly a top 3. - Conditional aggregation —
ROUND(100 SUM(CASE WHEN discount_applied = 'Yes' THEN 1 ELSE 0 END) / COUNT(), 2)to compute a discount rate per product in a single pass. CASEsegmentation — classifying customers as New / Returning / Loyal from their purchase history.- Subqueries — comparing individual spend against
(SELECT AVG(purchase_amount) …). - Type casting for correctness —
review_rating::numericbeforeROUND(), because Postgres stored the column asDOUBLE PRECISIONandROUND()behaves differently on floating point.
The Findings
| Question | Result |
|---|---|
| Headline KPIs | 3.9K customers · $59.76 average purchase · 3.75 average rating |
| Revenue by gender | Male $157,890 vs Female $75,191 |
| Customer segments | Loyal 3,116 · Returning 701 · New 83 |
| Revenue by age group | Young Adult $62,143 · Middle-aged $59,197 · Adult $55,978 · Senior $55,763 |
| Subscription mix | Only 27% of customers subscribe |
| Shipping | Express $60.48 vs Standard $58.46 average purchase |
| Top-rated products | Gloves (3.86) · Sandals (3.84) · Boots (3.82) |
What it means:
- The customer base is overwhelmingly loyal (3,116 of 3,900) — the commercial risk isn't acquisition, it's failing to monetise an already-retained base.
- Subscription is the biggest open opportunity: 73% of customers aren't subscribed, despite a loyal base that is well-suited to it.
- Revenue is remarkably even across age groups (a ~$6K spread), so age is a weak targeting variable — segment on behaviour instead.
- Discounts need scrutiny — several products depend heavily on discounted purchases, which risks training customers to wait for markdowns.
The Recommendations
- Boost subscriptions — promote exclusive subscriber benefits to convert the 73% non-subscribed majority.
- Build a loyalty programme — reward repeat buyers and move Returning customers into the Loyal segment.
- Review discount policy — balance volume against margin on the discount-dependent products.
- Prioritise by behaviour, not demographics — age barely differentiates revenue; previous-purchase behaviour does.
What's in this case study
- Power BI dashboard — the interactive Customer Behaviour Dashboard (KPI cards, slicers, category and age-group breakdowns).
- SQL Highlights — a curated, syntax-highlighted excerpt of the actual PostgreSQL, including the CTE segmentation and the windowed top-3-per-category query.